SalesPlay - Help Center
Top Searches:
Product
Stock
Invoice
Payment
SalesPlay Back Office
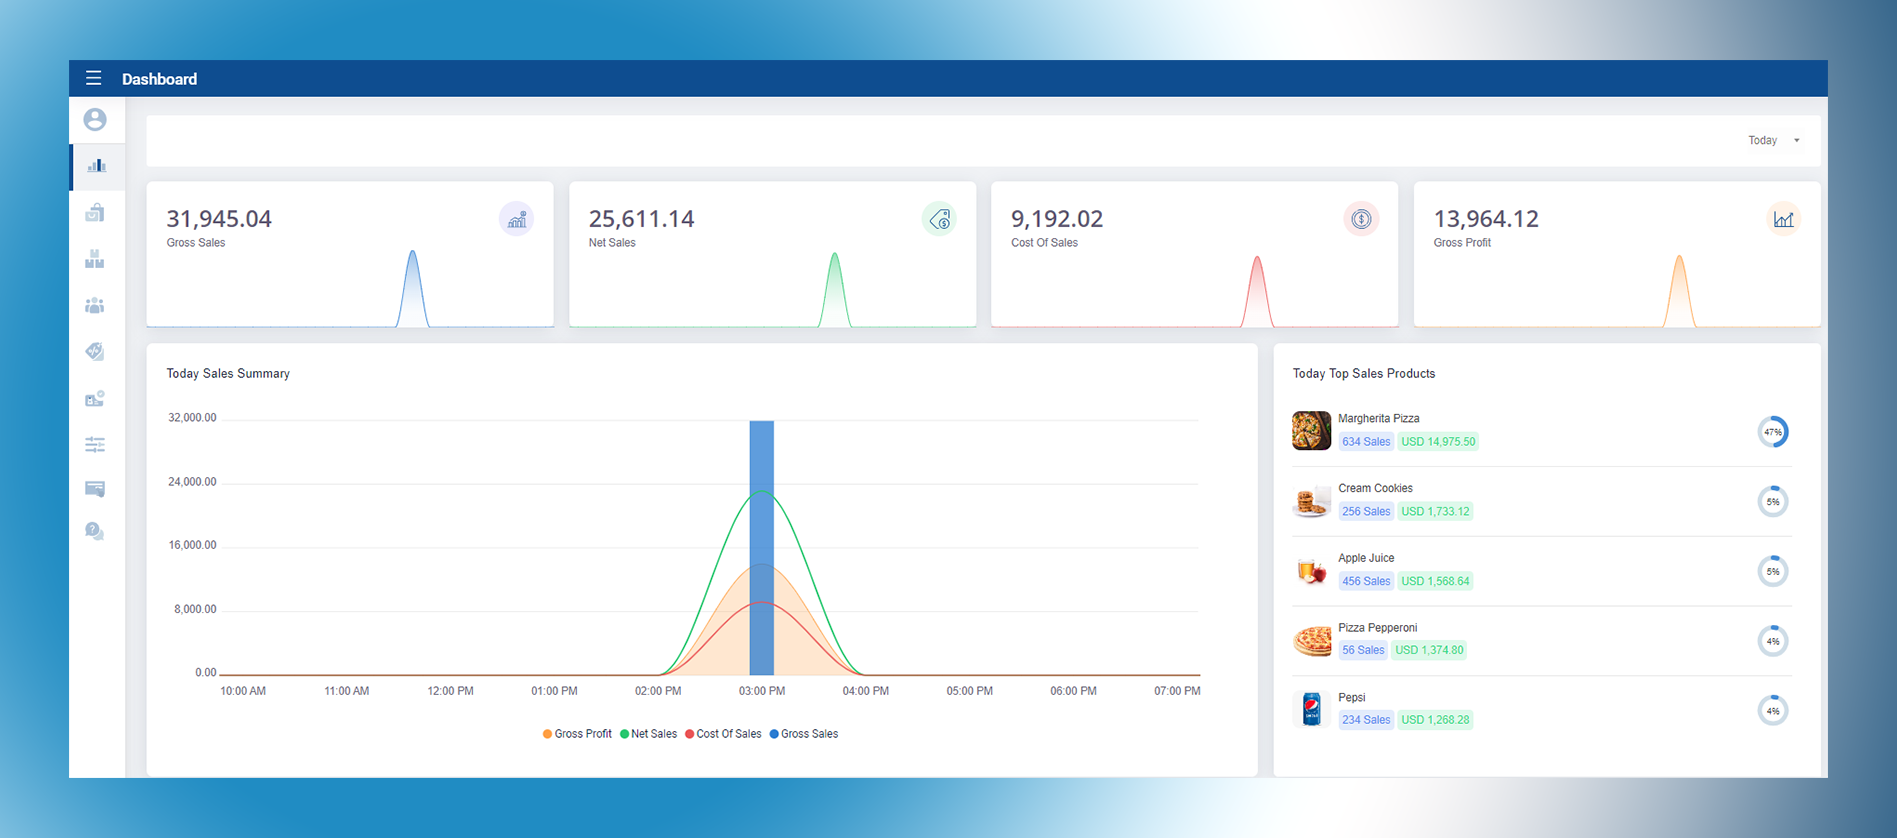
SalesPlay dashboard provides a quick and insightful view of your business's performance. With a user-friendly interface and powerful features,dashboard report gives you real-time visibility into crucial financial metrics, empowering you to make informed decisions and drive success.
The dashboard report offers a snapshot of key financial indicators, including Gross Sales, Net Sales, Cost of Sales, and Gross Profit. These metrics are essential for understanding your business's revenue generation, profitability, and cost management. With a glance at the dashboard, you can assess the health of your business at a high level.
To enhance usability, dashboard report allows you to filter data based on specific time frames. Whether you need insights for today, yesterday, this week, this month, last week or last month, you can effortlessly toggle between these options to analyze performance trends over different periods. This flexibility enables you to track progress, identify patterns, and react promptly to changing market conditions.
In addition to financial metrics, the dashboard report highlights the Top Sales Products, giving you valuable insights into your most popular and profitable items. This information helps you optimize inventory management, plan promotions effectively, and focus on products that drive revenue growth. By understanding which products perform best, you can make data-driven decisions that align with customer preferences and market demand.
SalesPlay dashboard is designed to streamline your decision-making process, offering a comprehensive overview of your business's financial health and product performance. It empowers you to identify opportunities, address challenges, and ultimately maximize profitability.

In addition to Gross Sales, Net Sales, Cost of Sales, and Gross Profit, Sales Dashboard offers valuable insights into discount usage, cash refunds, credit notes, and sales deductions.
Discounts play a significant role in driving customer loyalty and increasing sales. Sales dashboard report highlights the usage of discounts, allowing you to track and analyze how they impact your revenue. By understanding discount trends and their effects on your bottom line, you can fine-tune your pricing strategies and optimize discount campaigns for maximum profitability.
Cash refunds and credit notes are essential components of customer service and satisfaction. The dashboard report enables you to monitor and track the frequency and value of cash refunds and credit notes issued. This information helps you identify any patterns or issues that may require attention, allowing you to refine your refund and return policies and ensure a positive customer experience.
Sales deductions, another critical aspect of the dashboard report, provide insights into deductions made from sales, such as returns, allowances, or damaged goods. By monitoring sales deductions, you gain visibility into potential areas of improvement, such as product quality control or customer feedback management. This allows you to take proactive measures to minimize deductions and enhance overall profitability.
Was this helpful?